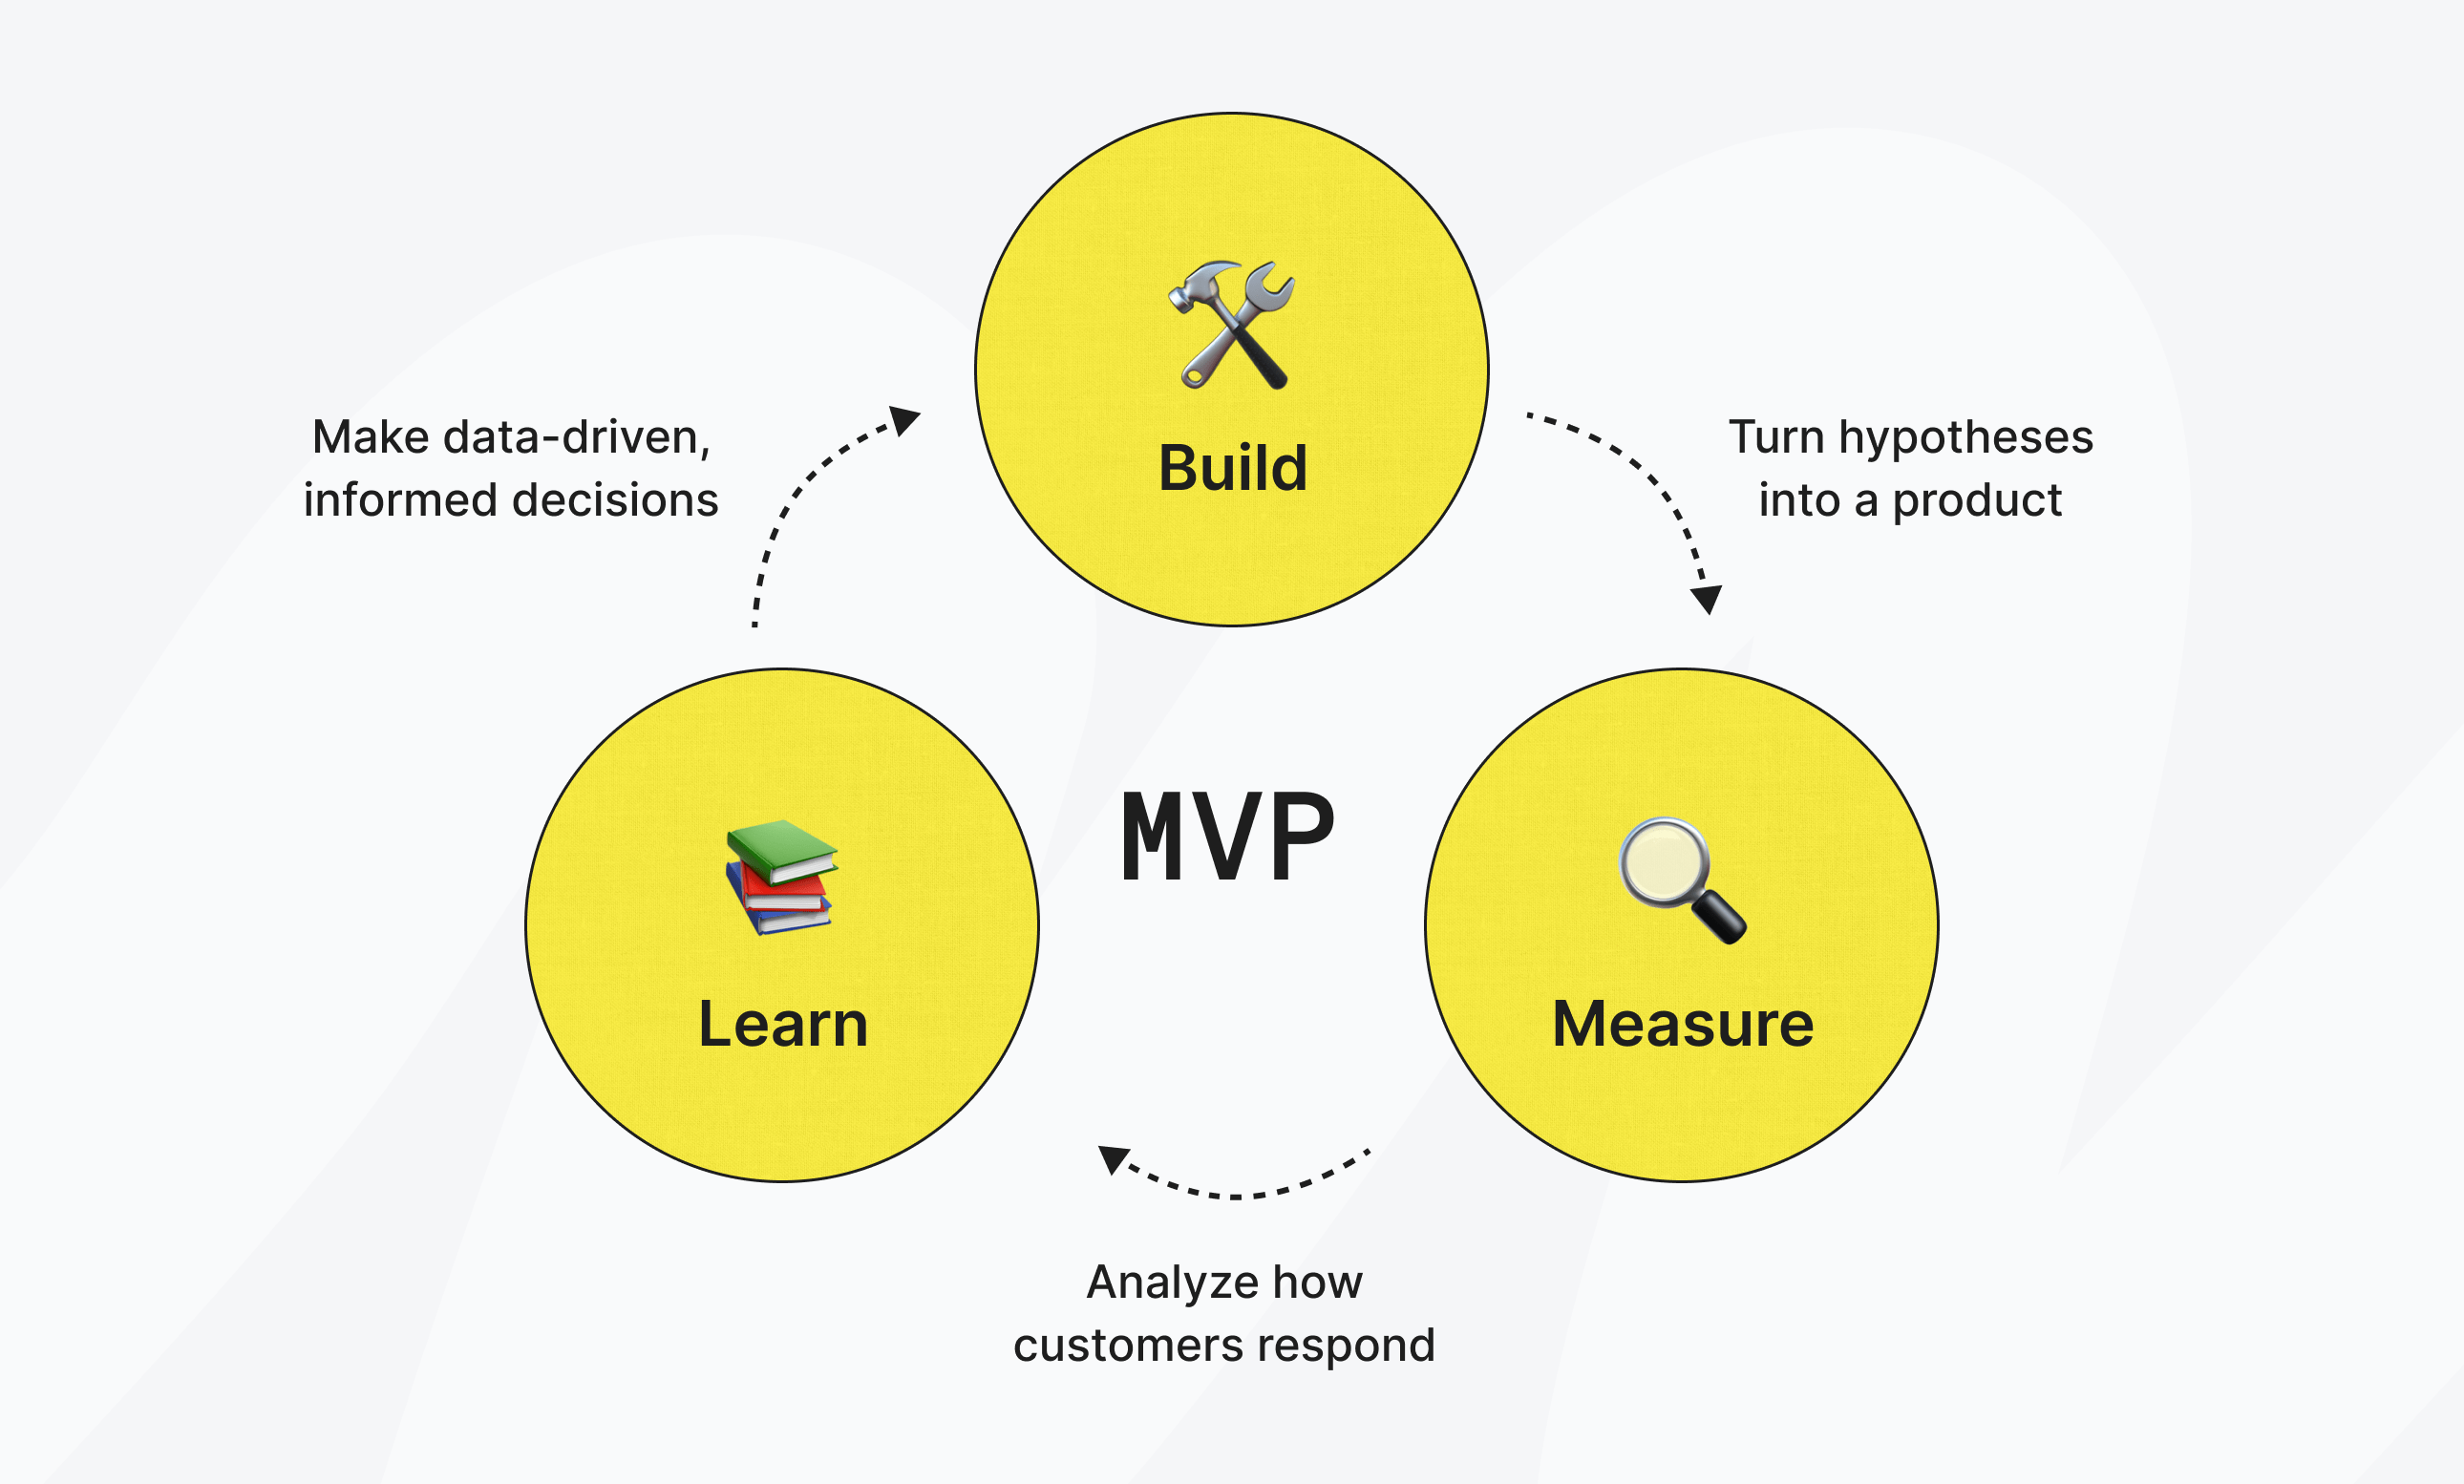





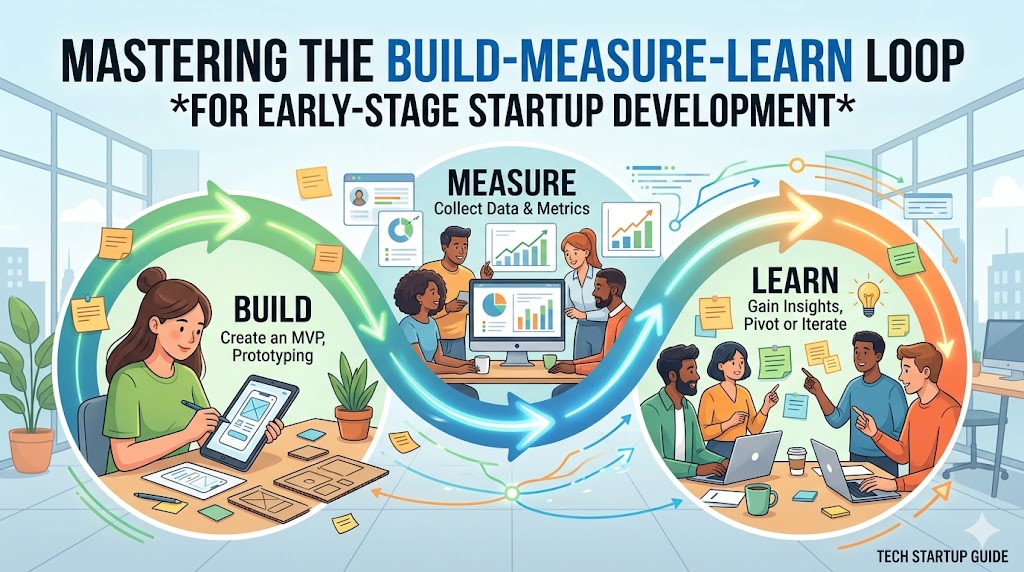
The Build-Measure-Learn loop is a central component of the Lean Startup methodology, designed to turn product development into a rapid, scientific process of learning. Coined by Eric Ries, it’s a continuous feedback loop where a team builds the smallest possible version of a product to test a core assumption, measures customer reactions, and learns from the data whether to pivot their strategy or persevere with the current direction.
The primary goal is to minimize wasted resources by ensuring development efforts are consistently aligned with validated customer needs, not just internal assumptions. Instead of building a product in a vacuum, the loop forces teams to get out of the building and test their riskiest assumptions first.
The most valuable output is not a finished product but validated learning—the rigorous, data-backed knowledge a team acquires about its customers and business model. This iterative process is the engine that drives a startup toward product-market fit.
The Three Phases of the Build-Measure-Learn Cycle
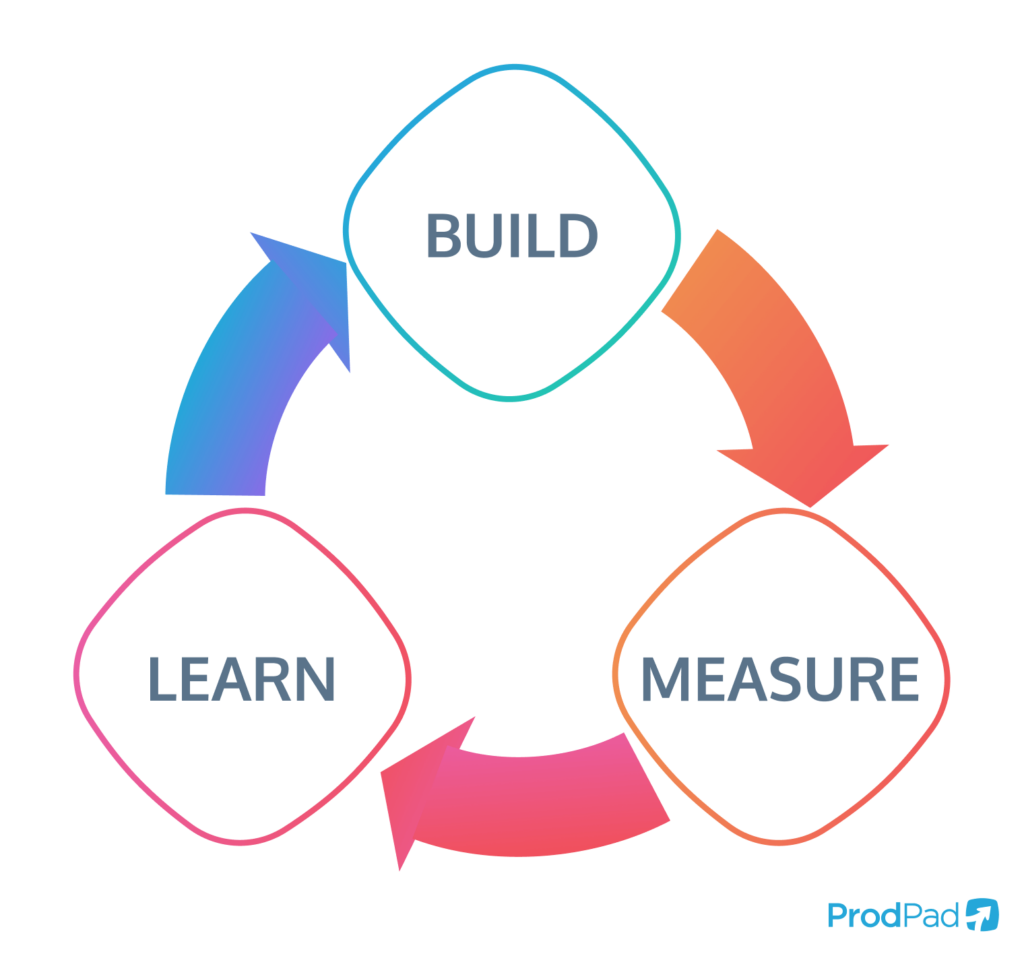
The BML loop is a continuous cycle with three phases. The key to success is to move through this cycle as quickly as possible, as each iteration reduces risk and brings the business closer to a viable model.
[Placeholder for a custom diagram showing a circular arrow flow from Ideas -> Build (Product) -> Measure (Data) -> Learn (Insights) and back to Ideas.]
This feedback loop begins with ideas, which are framed as testable hypotheses. These hypotheses are turned into a product (the MVP) in the Build phase. The team then Measures customer response to generate data. This data is analyzed in the Learn phase to produce actionable insights, which inform the next set of ideas. The faster a team can learn, the less capital it wastes building things customers don't want.
Phase 1: Build — Creating Your Minimum Viable Product (MVP)
The 'Build' phase is where an abstract hypothesis is turned into a tangible artifact for testing with real users.
- Core Task: Transform a core business assumption into a Minimum Viable Product (MVP). An MVP is the version of a product that allows a team to collect the maximum amount of validated learning with the least amount of development effort.
- The MVP Misconception: A common mistake is thinking "Build" exclusively means writing code. The goal is maximum learning with minimum effort. An MVP is an experiment, not just a smaller version of the final product. It can be anything from a simple survey to a single-feature application.
- Types of MVPs: The artifact created should directly correspond to the hypothesis being tested. A well-designed MVP, even a simple one, provides a clear signal from the market.
| MVP Type | Primary Purpose | Effort Level | Best For Testing... |
|---|---|---|---|
| Landing Page MVP | Gauge customer interest and validate the value proposition. | Low | Problem-solution fit, messaging, and pricing sensitivity. |
| Explainer Video MVP | Demonstrate a product's functionality and benefits before it's built. | Low-Medium | Product concept, user workflow, and overall demand (as famously done by Dropbox). |
| Wizard of Oz MVP | Simulate a fully functional product with manual backend processes. | Medium | Service viability, process complexity, and customer interaction flows. |
| Concierge MVP | Manually deliver the service to a small group of early adopters without technology. | High | Deep customer insights, problem validation, and what customers are willing to pay for. |
| Single-Feature MVP | A coded product with only the most critical function to solve one key problem. | High | Core feature utility, technical feasibility, and initial user behavior patterns. |
Phase 2: Measure — Gathering Data with Actionable Metrics
Once the MVP is in the hands of early adopters, the 'Measure' phase begins. The goal is to collect objective, unbiased data about user behavior.
- Core Task: Collect quantitative (what users do) and qualitative (why they do it) data. This phase determines if development efforts are leading to meaningful progress.
- Actionable Metrics vs. Vanity Metrics: It is critical to focus on metrics that inform decisions. Vanity metrics look impressive but don't show cause and effect. Actionable metrics provide clear insight into business health and the impact of changes.
| Vanity Metrics (Avoid These) | Actionable Metrics (Focus on These) |
|---|---|
| Total sign-ups | New sign-ups per week |
| Cumulative pageviews | Conversion rate (e.g., visit to sign-up) |
| Total downloads | Daily/Monthly Active Users (DAU/MAU) |
| Social media followers | Customer Acquisition Cost (CAC) |
| Raw number of features shipped | Customer Lifetime Value (CLV) |
| Churn/Retention Rate |
- Innovation Accounting: Eric Ries introduced innovation accounting as a way to measure progress:
- Establish a Baseline: Use the MVP to get real data on the current state (e.g., a 1% conversion rate on your landing page).
- Tune the Engine: Make a single, specific change to improve a key metric (e.g., change the headline).
- Pivot or Persevere: Measure the impact. If the conversion rate jumps to 4%, persevere. If it stays at 1%, the data suggests a bigger change—a pivot—may be needed.
Phase 3: Learn — The Decision to Pivot or Persevere
The 'Learn' phase is the critical point of reflection where raw data is converted into a strategic decision. This is where validated learning happens.
- Core Task: Analyze the data and feedback from the 'Measure' phase to make an informed choice: pivot or persevere.
- Validating or Invalidating Hypotheses: The learning process circles back to the initial hypothesis. Did the experiment prove or disprove the assumption? For example, if the hypothesis was "Customers will pay $10/month," but measurement showed a 98% drop-off at the pricing page, the hypothesis is invalidated.
- The Pivot: A pivot is a structured course correction to test a new fundamental hypothesis about the product, business model, or engine of growth. It is not failure, but a strategic milestone built on learning. Common types include:
- Zoom-in Pivot: A single feature of the product becomes the entire product.
- Customer Segment Pivot: The product is repositioned to serve a different customer base.
- Technology Pivot: A new technology is used to achieve the same solution more effectively.
- Perseverance: If the data validates the core hypothesis and actionable metrics are trending positively, the decision is to persevere. This means continuing on the current path while using subsequent BML cycles for optimization and refinement.
The BML Loop in Action: A Simple Walkthrough
Imagine a team wants to build a mobile app that helps dog owners find nearby, off-leash dog parks.
- Idea & Hypothesis: The team assumes, "Dog owners struggle to find safe, off-leash parks and will use a simple map-based app to solve this."
- Build (MVP): Instead of building a full app, they create a simple landing page with a sign-up form for updates. The page shows a mockup of the app's main map screen and lists three key features. This is a low-effort MVP to test demand.
- Measure (Data): They run a small ad campaign targeting dog owners in their city, directing them to the landing page. They measure one key actionable metric: the percentage of visitors who sign up with their email.
- Learn (Insights): After a week, they find a 25% conversion rate, which is very high. This validates their core hypothesis that the problem is real and their proposed solution is desirable. The decision is to persevere and move on to the next riskiest assumption: "Will people contribute user-generated content, like park reviews?" Their next loop will focus on testing that.